Deducing Rock Properties from Spectral Seismic Data
Date: Wed, Aug 5, 2015
Location: Institute for Mathematics and its Applications
Conference: PIMS-IMA Math Modeling in Industry XIX
Subject: Mathematics, Applied Mathematics
Class: Scientific
Abstract:
Seismic Data in Exploration Geoscience
The recovery and production of hydrocarbon resources begins with an exploration of the earth’s subsurface, often through the use of seismic data collection and analysis. In a typical seismic data survey, a series of seismic sources (e.g. dynamite explosions) are initiated on the surface of the earth. These create vibrational waves that travel into the earth, bounce off geological structures in the subsurface, and reflect back to the surface where the vibrations are recorded as data on geophones. Computer analysis of the recorded data can produce highly accurate images of these geological structures which can indicate the presence of reservoirs that could contain hydrocarbon fluids. High quality images with an accurate analysis by a team of geoscientists can lead to the successful discovery of valuable oil and gas resources. Spectral analysis of the seismic data may reveal additional information beyond the geological image. For instance, selective attenuation of various seismic frequencies is a result of varying rock properties, such as density, elasticity, porosity, pore size, or fluid content. In principle this information is present in the raw data, and the challenge is to find effective algorithms to reveal these rock properties.
Spectral Analysis
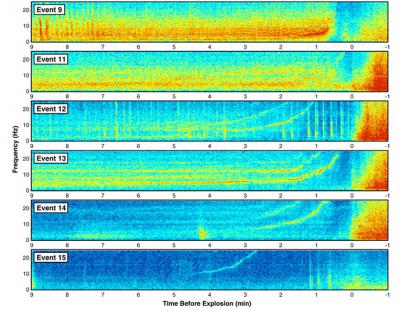
Through the Fourier transform, frequency content of a seismic signal can be observed. The Short Time Fourier transform is an example of a time-frequency method that decomposes a signal into individual frequency bands that evolve over time. Such time-frequency methods have been successfully used to analyze complex signals with rich frequency content, including recordings of music, animal sounds, radio-telescope data, amongst others. These time-frequency methods show promise in extracting detailed information about seismic events, as shown in Figure 1, for instance.

Figure 1: Sample time-frequency analysis of a large seismic event (earthquake). From Hotovec, Prejean, Vidale, Gomberg, in J. of Volcanology and Geothermal Research, V. 259, 2013.
Problem Description
Are existing time-frequency analytical techniques effective in providing robust estimation of physical rock parameters that are important to a successful, economically viable identification of oil and gas resources? Can they accurate measure frequency-dependent energy attenuation, amplitude-versus-offset effects, or other physical phenomena which are a result of rock and fluid properties?
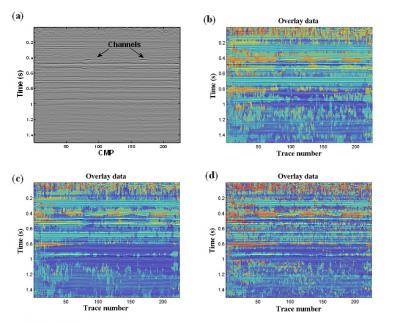
Using both synthetic and real seismic data, the goal is to evaluate the effectiveness of existing time-frequency methods such as Gabor and Stockwell transforms, discrete and continuous wavelet transforms, basis and matching pursuit, autoregressive methods, empirical mode decomposition, and others. Specifically, we would like to determine whether these methods can be utilized to extract rock parameters, and whether there are modifications that can make them particularly effective for seismic data.
The source data will include both land-based seismic surveys as well as subsurface microseismic event recordings, as examples of the breadth of data that is available for realistic analysis.

Figure 2: (a). Seismic data set from a sedimentary basin in Canada. The erosional surface and channels are highlighted by arrows. The same frequency attribute are extract from short time Fourier transform (b), continuous wavelet transform (c) and empirical mode decomposition (d).


